

Model results for stream flow at the downstream outlet of the Wabash River watershed show a large variability between the 10 different GCMs, and it is uncertain whether stream flow will increase or decrease at the annual time scale (Figure 2, top row). However, our computer models show that stream flow in summer and fall (June through November) will likely decrease in the future (Figure 2, bottom row).
Projecting future water quantity in Indiana
To simulate hydrologic conditions within the Wabash watershed for future periods, we used climate projections that have been statistically downscaled by researchers at the University of Notre Dame. These downscaled climate projections are based on outputs from 10 different Global Climate Models (GCMs) chosen for their accuracy in reproducing climate variability in the Midwest. For this project, we used climate projections based on two different greenhouse gas concentration scenarios: Representative Concentration Pathways (RCP) 4.5 and 8.5, representing a medium and high emissions scenario.
Users will note that employing different GCMs and other input datasets produces different results, and that even the wide ranges presented do not represent the full range of possibilities
Using the climate projections as inputs for our watershed model, we simulated the hydrologic cycle within the Wabash River watershed through to the end of the century (year 2100). Outputs from the model, including soil moisture, stream flow, and other water balance components, were then analyzed for three future periods: near future (2020s; 2011-2040), mid-future (2050s; 2041-2070), and far-future (2080s, 2071-2100). By comparing the outputs from these simulations for the future periods to the past, we can see how Indiana’s hydrology may change in the future.
How will stream flow patterns change in the future?
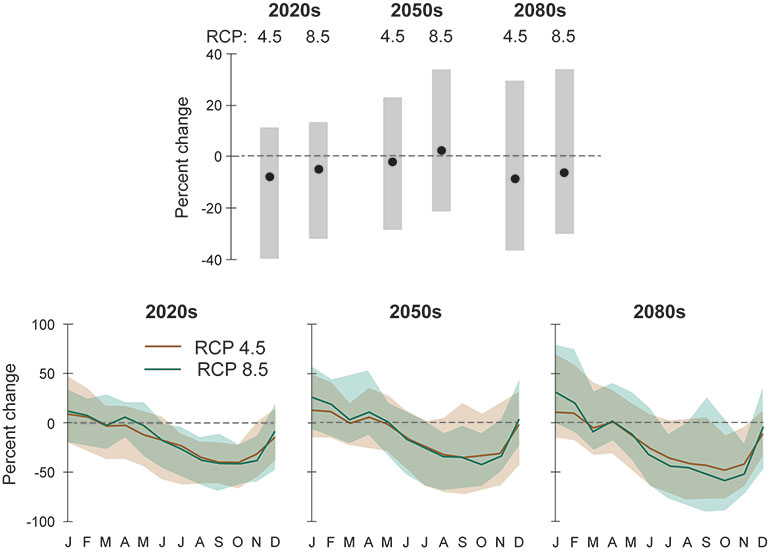
Figure 2. Projected change in streamflow at the Wabash Basin outlet for the 2020s (2011-2040), 2050s (2041-2070), and 2080s (2071-2100) for representative concentration pathways (RCPs) 4.5 and 8.5, corresponding to medium and high emissions scenarios, respectively. Top row: Percent change in mean annual streamflow. Black circles show the ensemble mean; gray bars showing the ensemble range. Bottom row: Percent change in mean monthly streamflow. Lines show the ensemble mean; shading shows the ensemble range.
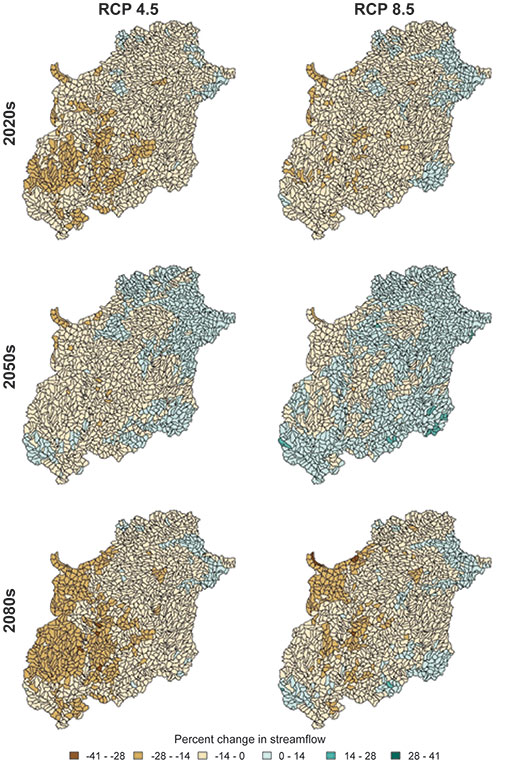
Subbasin level results (Figure 3) reveal spatial variability in the response of stream flow to climate change, with decreases in mean annual stream flow more likely in the west and southwest portions of the Wabash River watershed.
Figure 3. Projected change in mean annual streamflow for the 2020s (2011-2040), 2050s (2041-2070), and 2080s (2071-2100) at the subbasin scale for representative concentration pathways (RCPs) 4.5 and 8.5, which correspond to medium and high emissions scenarios, respectively.
Our hydrological data and model source codes are hosted on IU’s exceptional High-Performance Computing cyberinfrastructure. Collaborators can run their own models by modifying the input files or mine the huge caches of modeling output files stored on Big Red 200 and analyze the data to answer questions related to their own disciplines. Contact Professor Chen Zhu with your idea and needs.